Determinants of Health
Health is more than medical care
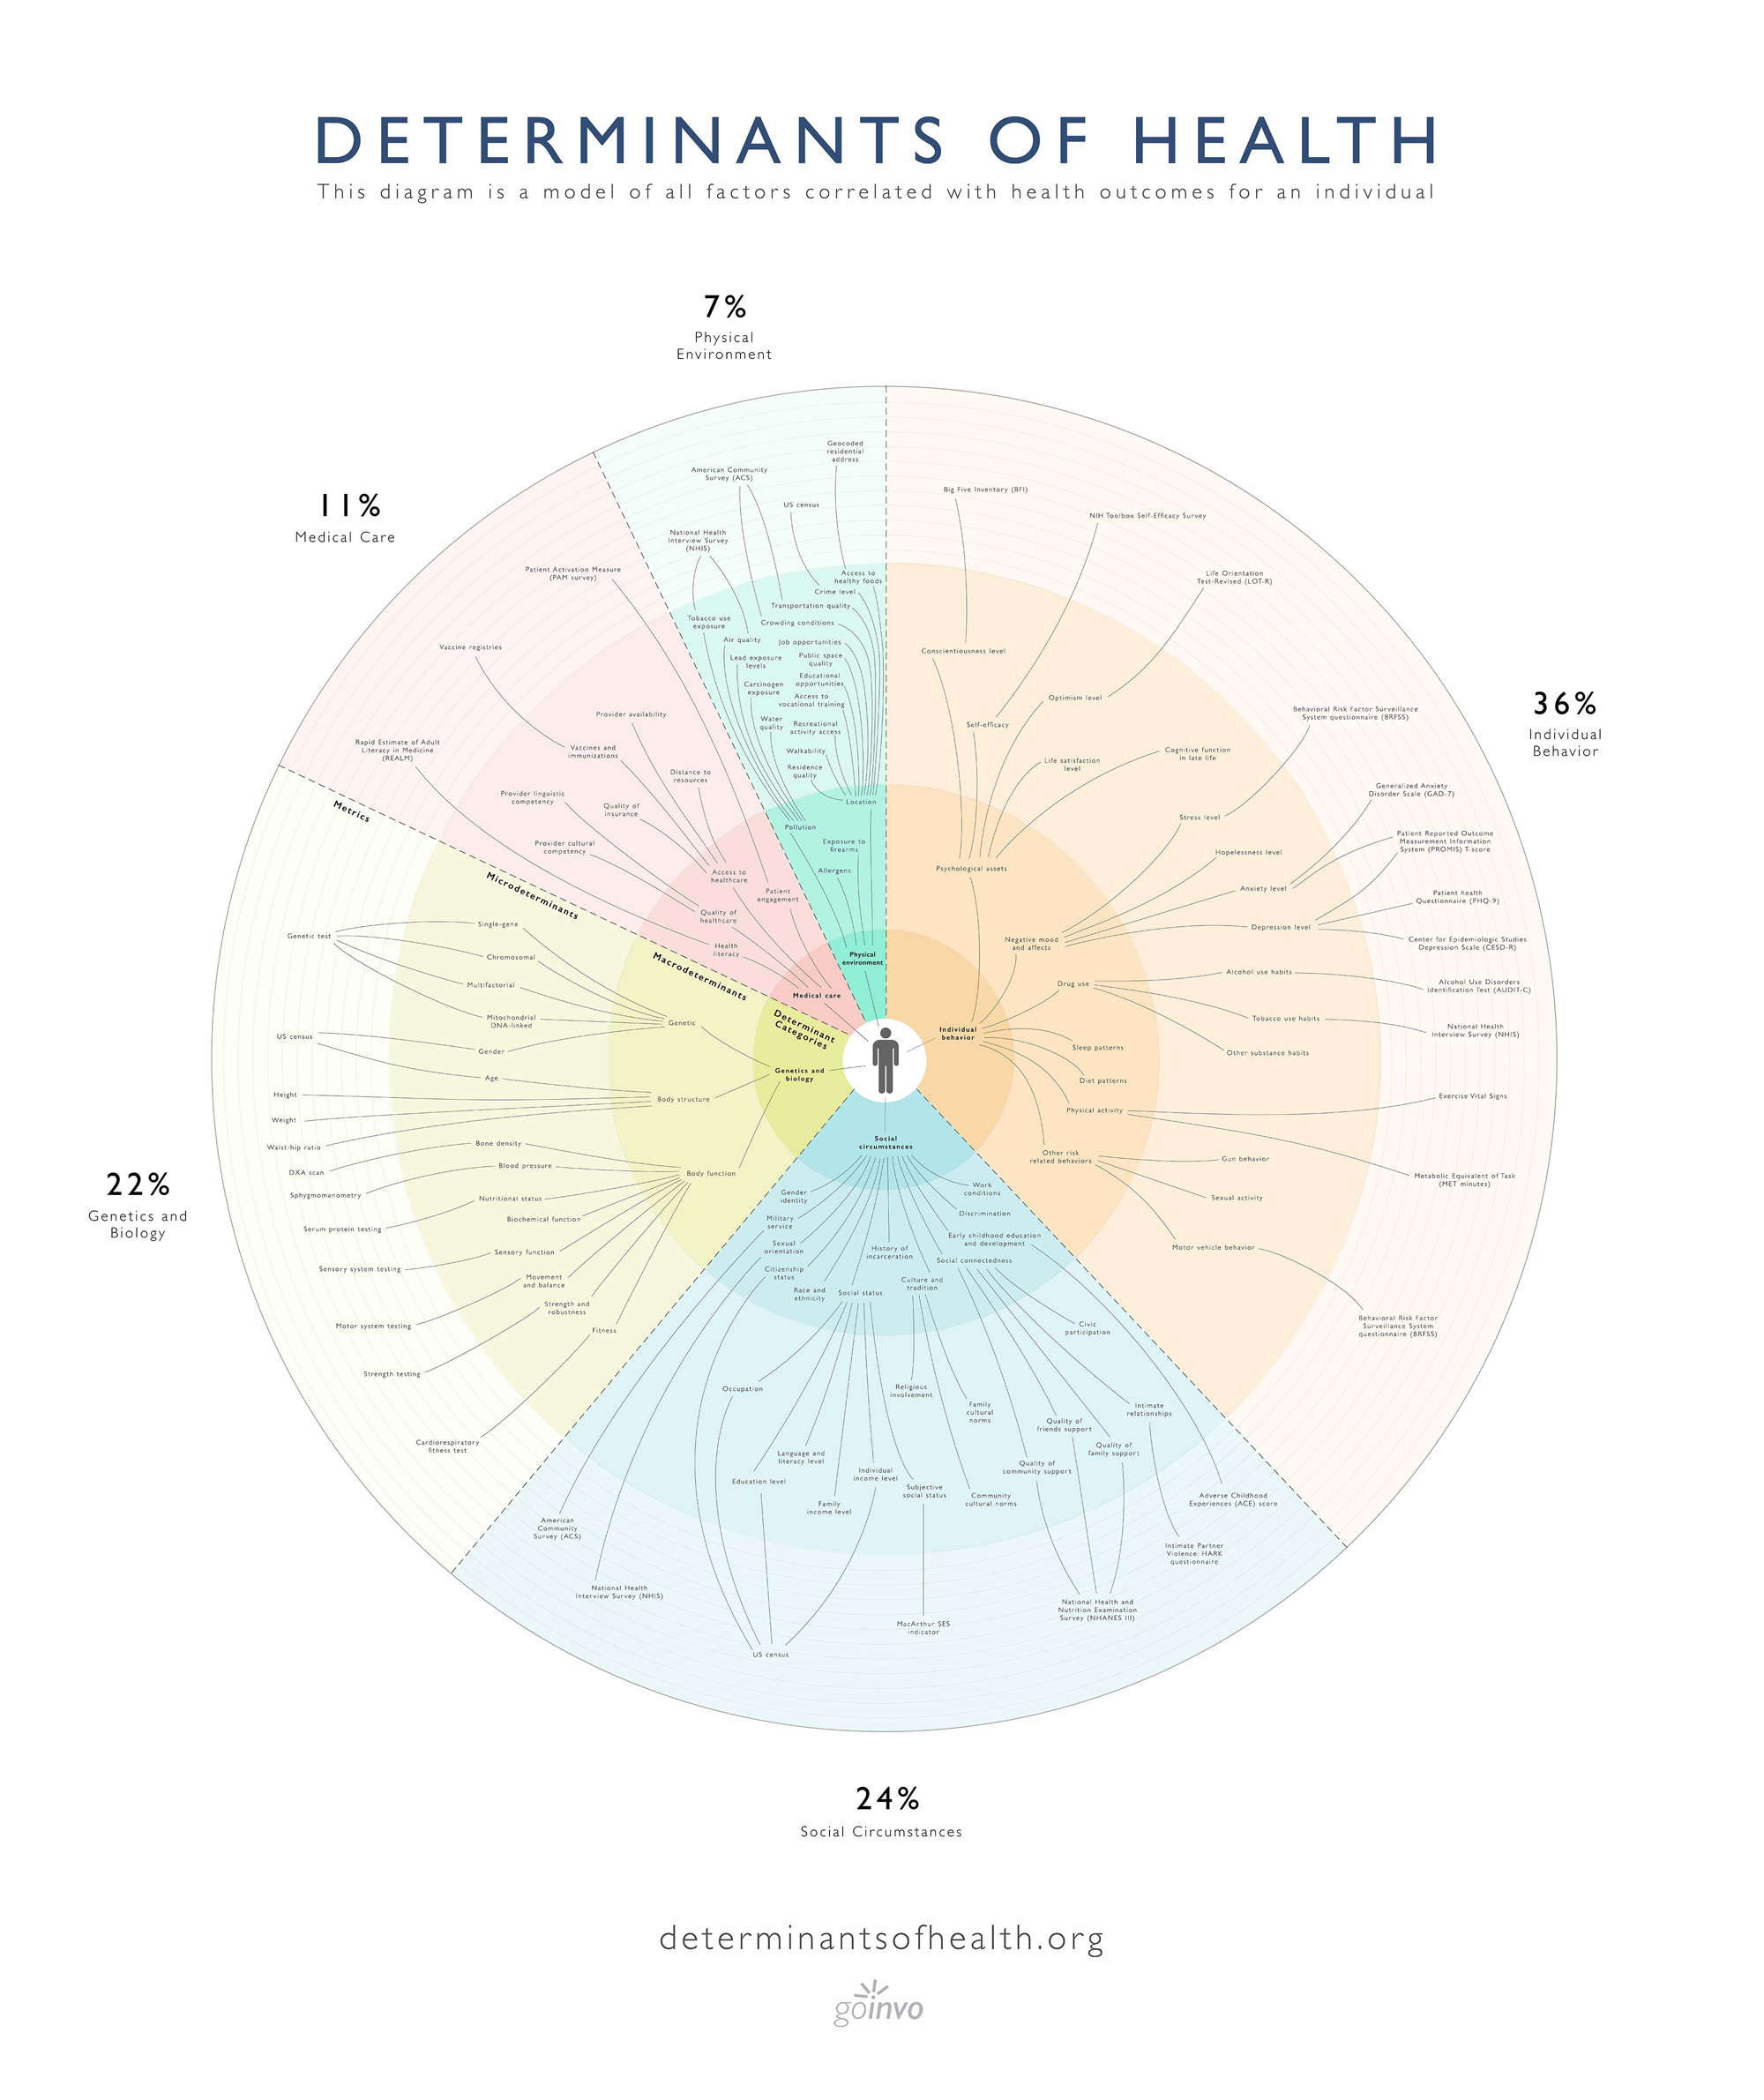
89% of health occurs outside of the clinical space through our genetics, behavior, environment and social circumstances. These factors are known as the social determinants of health. Despite their importance, attempts to integrate the determinants into a single visualization have been limited.
GoInvo identified this gap based on their extensive work as a healthcare design studio and conducted a literature review of sources (World Health Organization and the Kaiser Family Foundation) and face to face interviews with public policy analysts, health IT experts, and clinical professionals. Relying on their experience of mapping complex systems within healthcare, GoInvo created a comprehensive open source visualization of the social determinants of health.
What are the 5 determinants of health?
Researchers group the many factors that shape our health into five broad determinants. Based on GoInvo's review of leading sources (the World Health Organization, the Kaiser Family Foundation, the Institute of Medicine, and others), here is their estimated contribution to overall health:
- Individual behavior, about 36% (diet, activity, smoking, and other daily choices)
- Social circumstances, about 24% (education, income, employment, and community)
- Genetics & biology, about 22% (inherited traits and biological factors)
- Medical care, about 11% (access to and quality of clinical care)
- Environment, about 7% (air, water, housing, and physical surroundings)
Together, the four non-clinical determinants account for roughly 89% of our health outcomes, which is why care that stops at the clinic door misses most of what keeps us healthy. These percentages are GoInvo's estimates, averaged across multiple peer-reviewed sources; the full calculation is documented in the methodology below.
Tap the categories to explore
Individual Behavior
Smoking habits, sleep and exercise patterns, sexual activity, and mood levels are all examples of individual behavior, which is a critical determinant for our physical health, mental health, and overall well being. Positive changes to our individual behavior can reduce the risk for developing a variety of diseases, and many public health interventions have already focused on altering dangerous behaviors.
Psychological Assets
- Conscientiousness level
- Self-efficacy
- Optimism level
- Life satisfaction level
- Cognitive function in late life
Negative Mood and Affects
- Stress level
- Hopelessness level
- Anxiety level
- Depression level
Other Risk Related Behavior
- Gun behavior
- Sexual activity
- Motor vehicle behavior
Physical Activity
Sleep Patterns
Diet Patterns
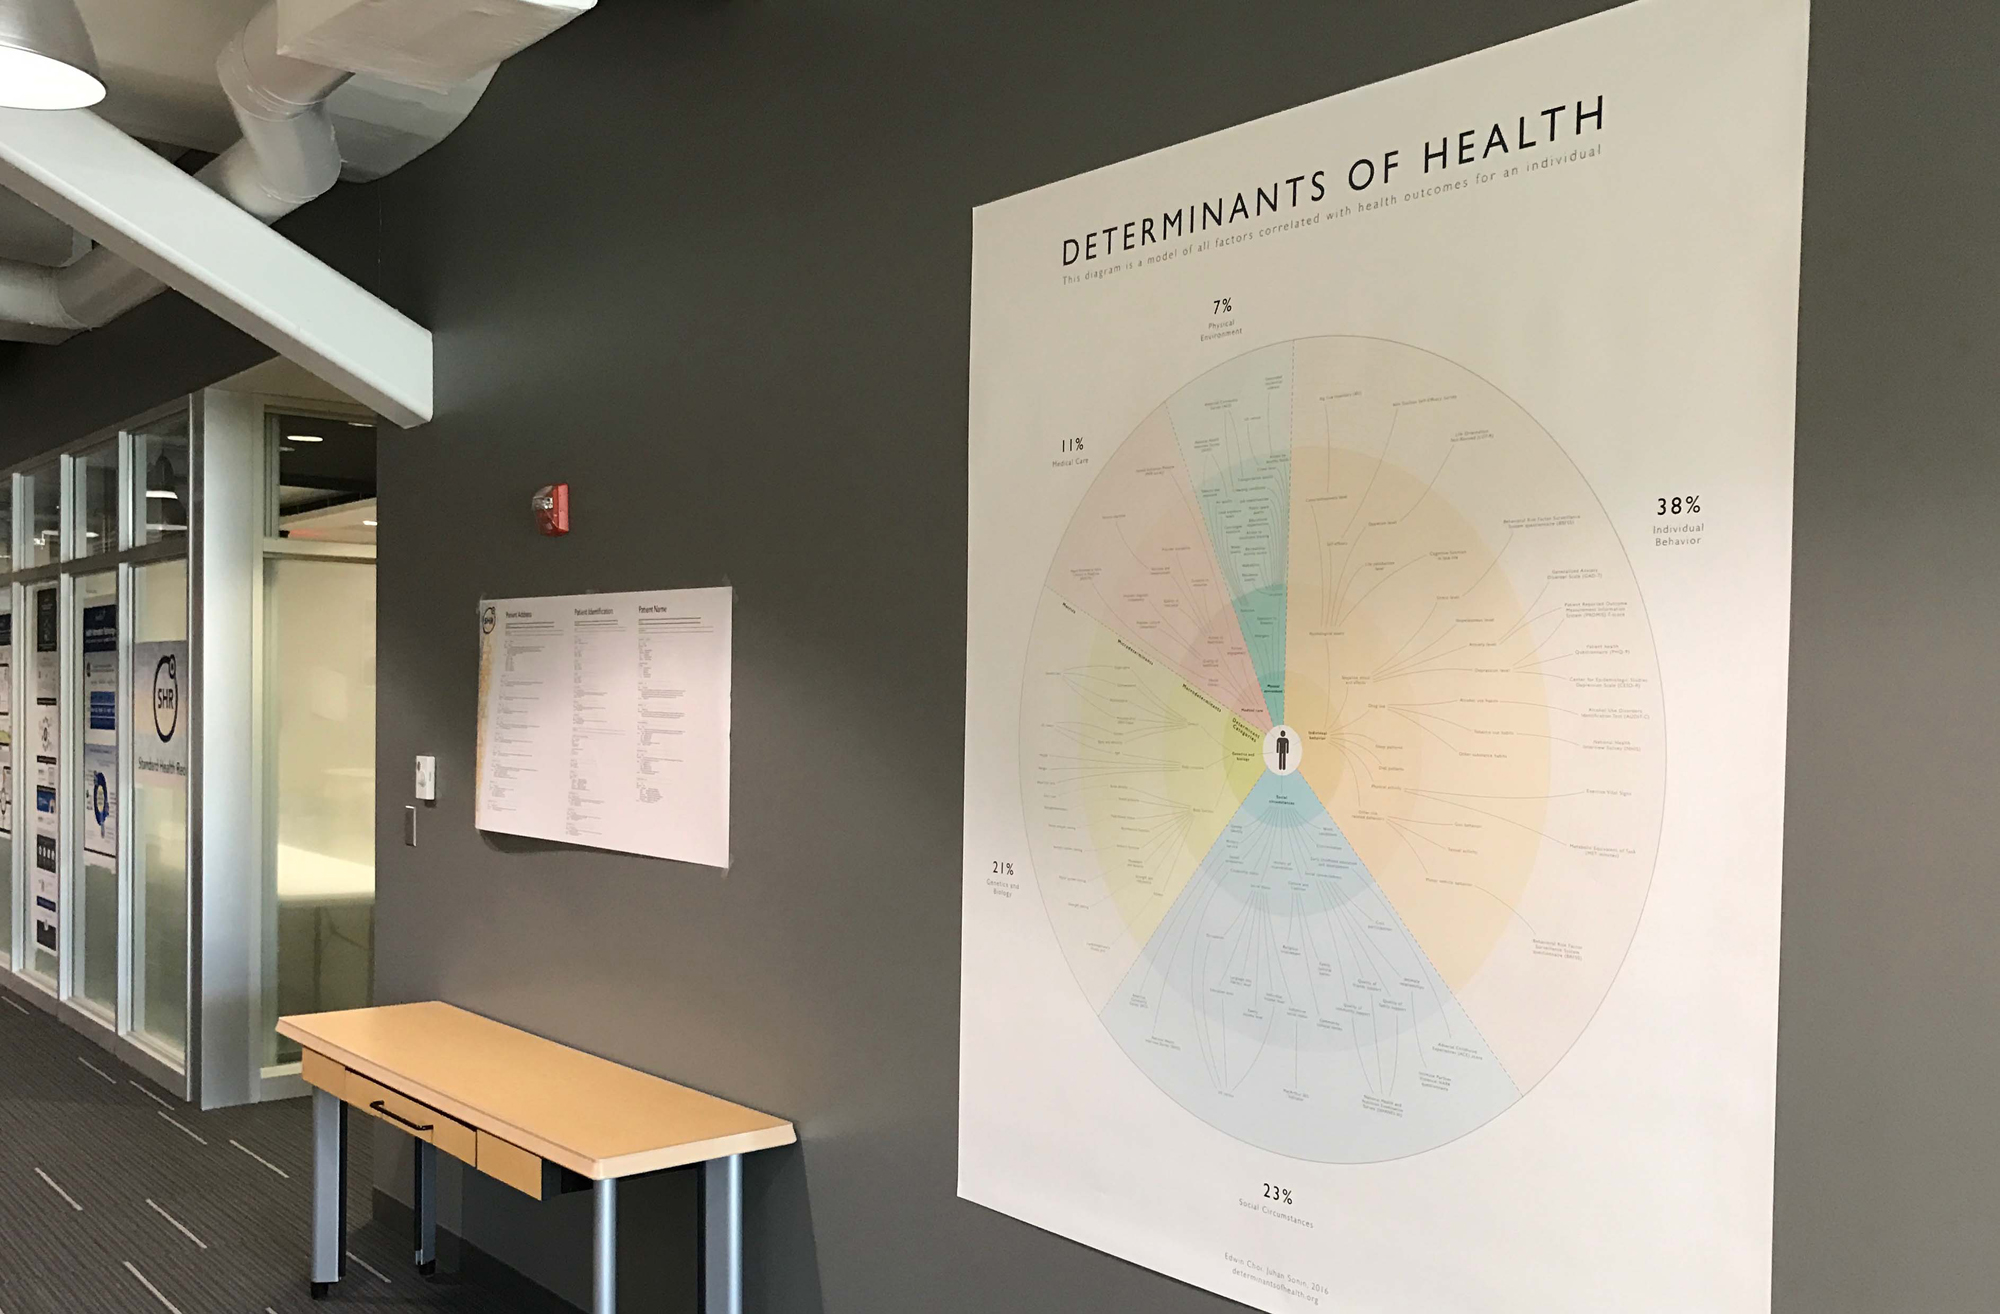

The Determinants of Health is available as a poster, an installation, a download, and an interactive visualization.
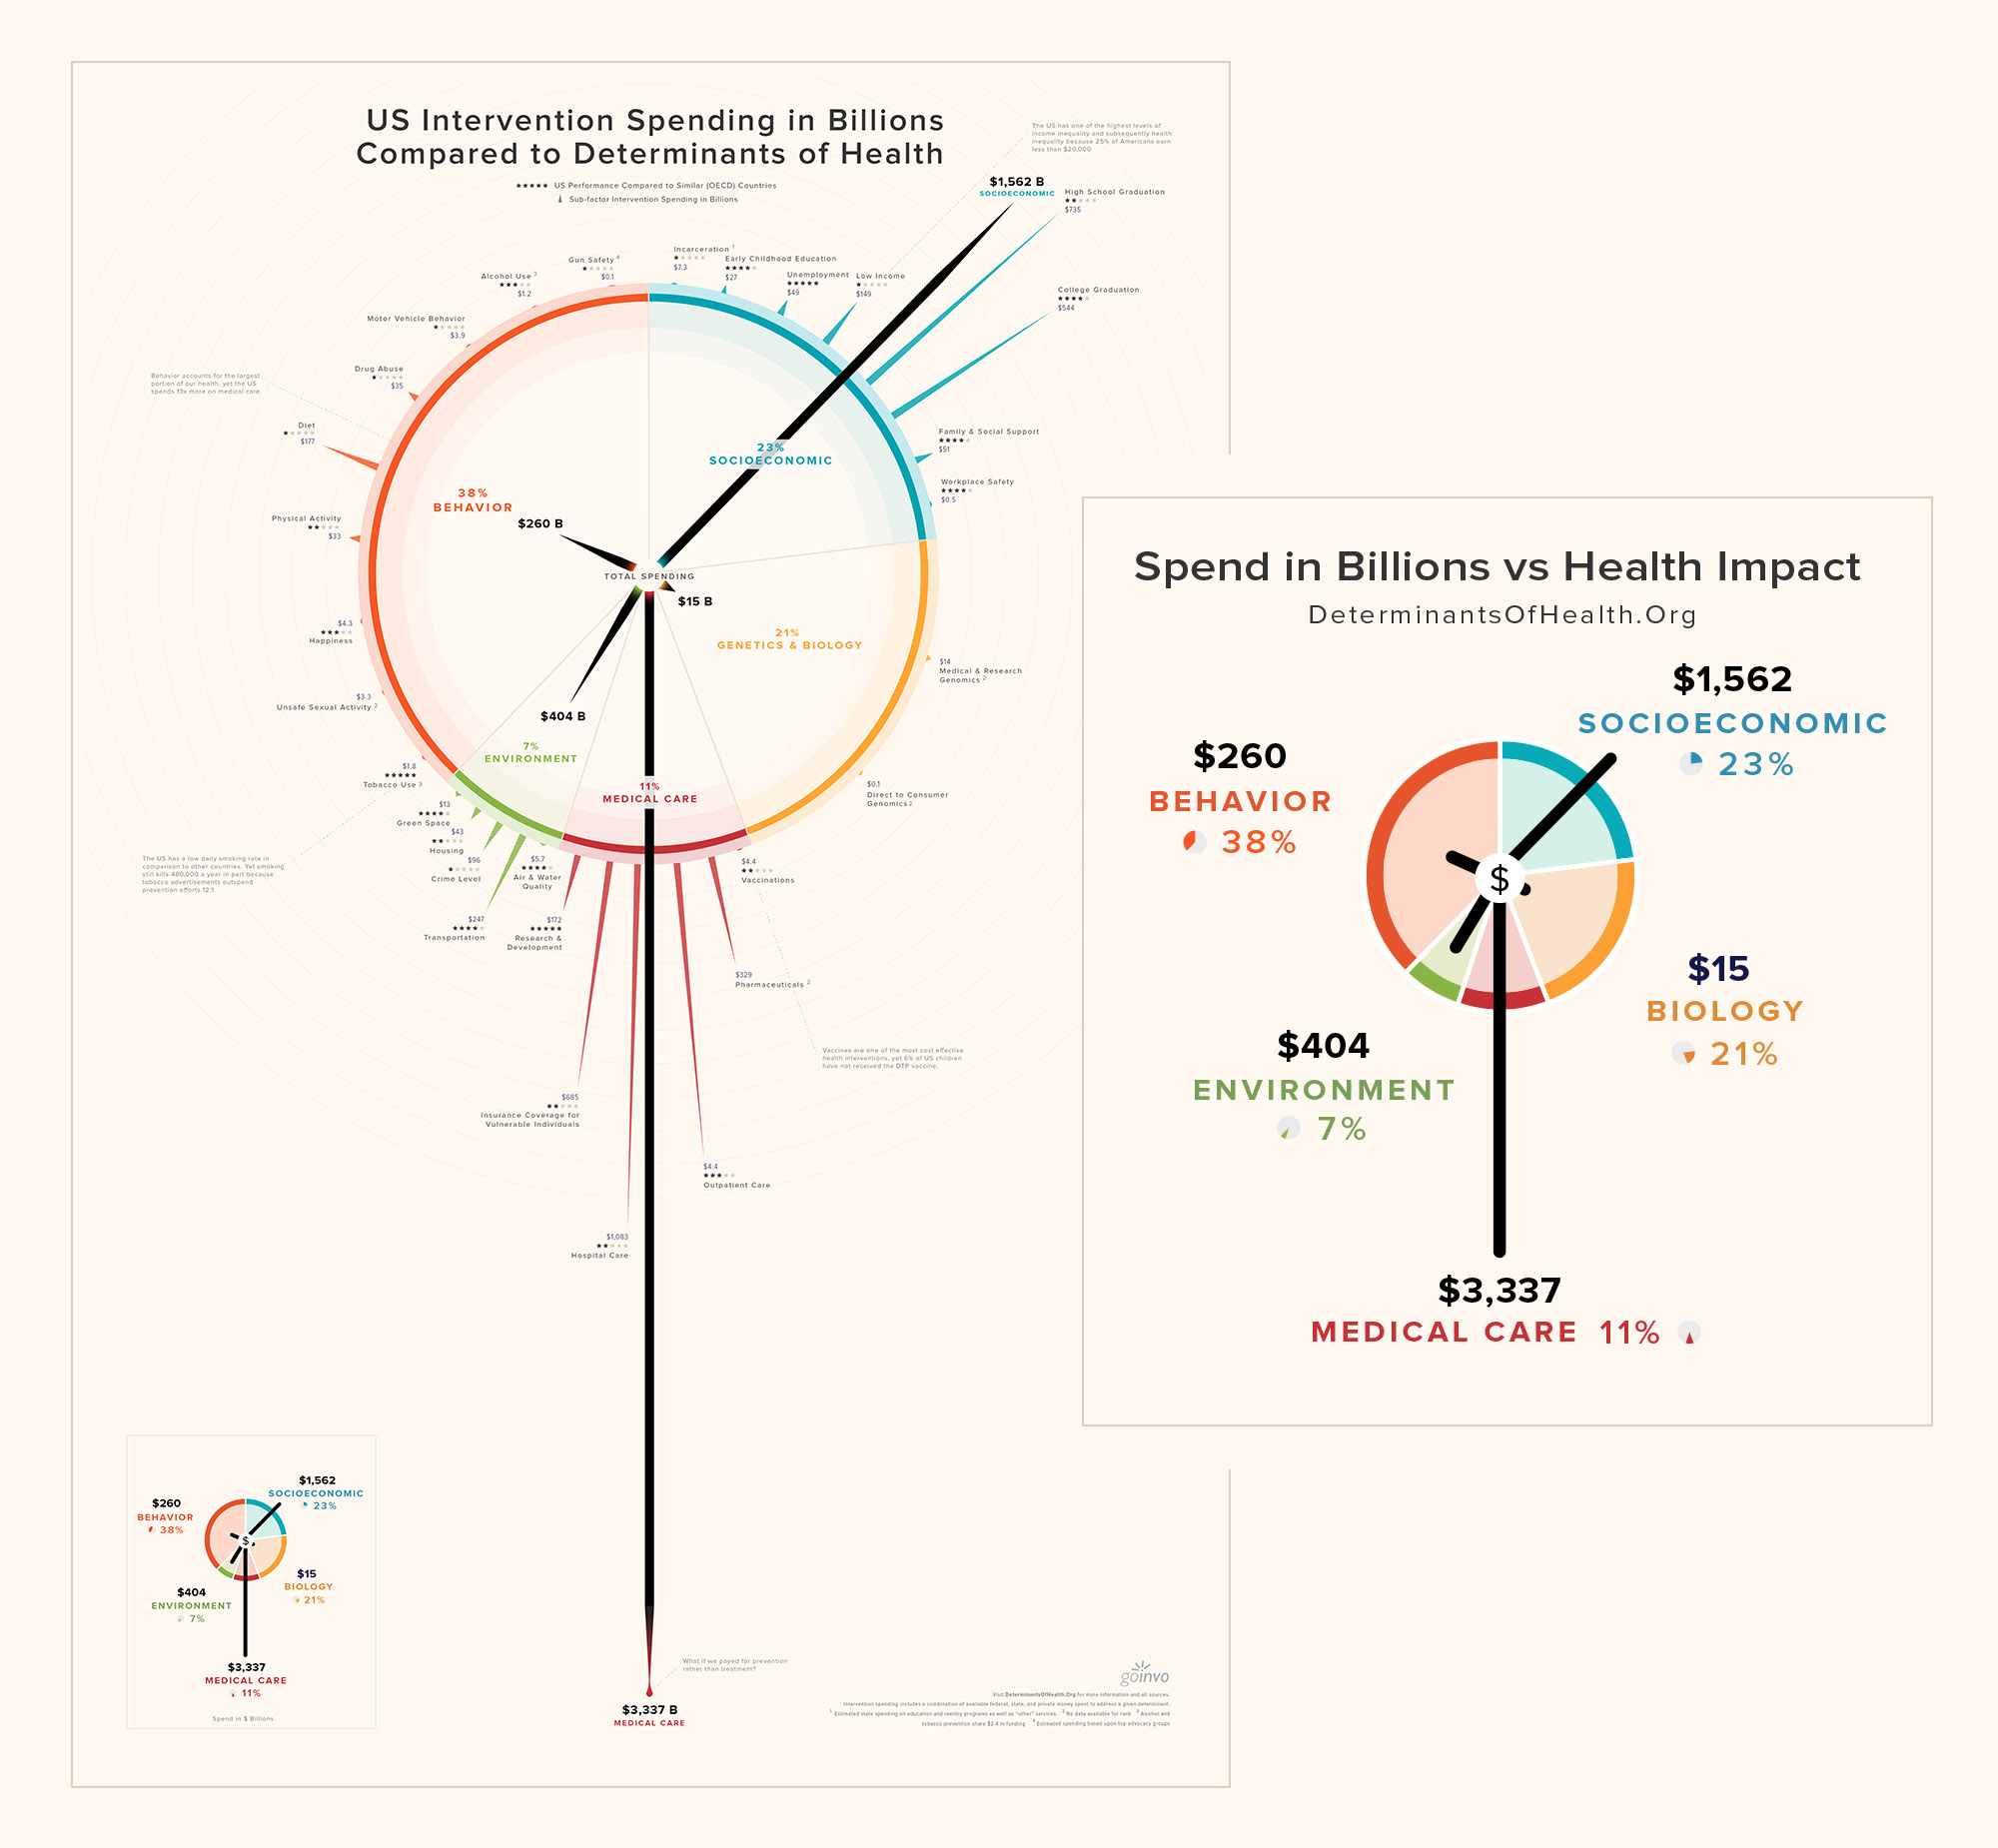
Determinants Compared to Spending
We'd Like Your Feedback
We've mapped the most recent available federal, state, and relevant private intervention spending to the determinants of health. Where data is available, we've also compared United States performance to a group of comparable countries (OECD countries). Explore the poster and references then send your feedback on this draft to hello@goinvo.com
Note: Intervention spending is money spent to address the problem. It is not total money spent in that area. For example, we list reentry and education program spending for incarcerated individuals and not the total cost of incarceration. Where data is not available it is not displayed.
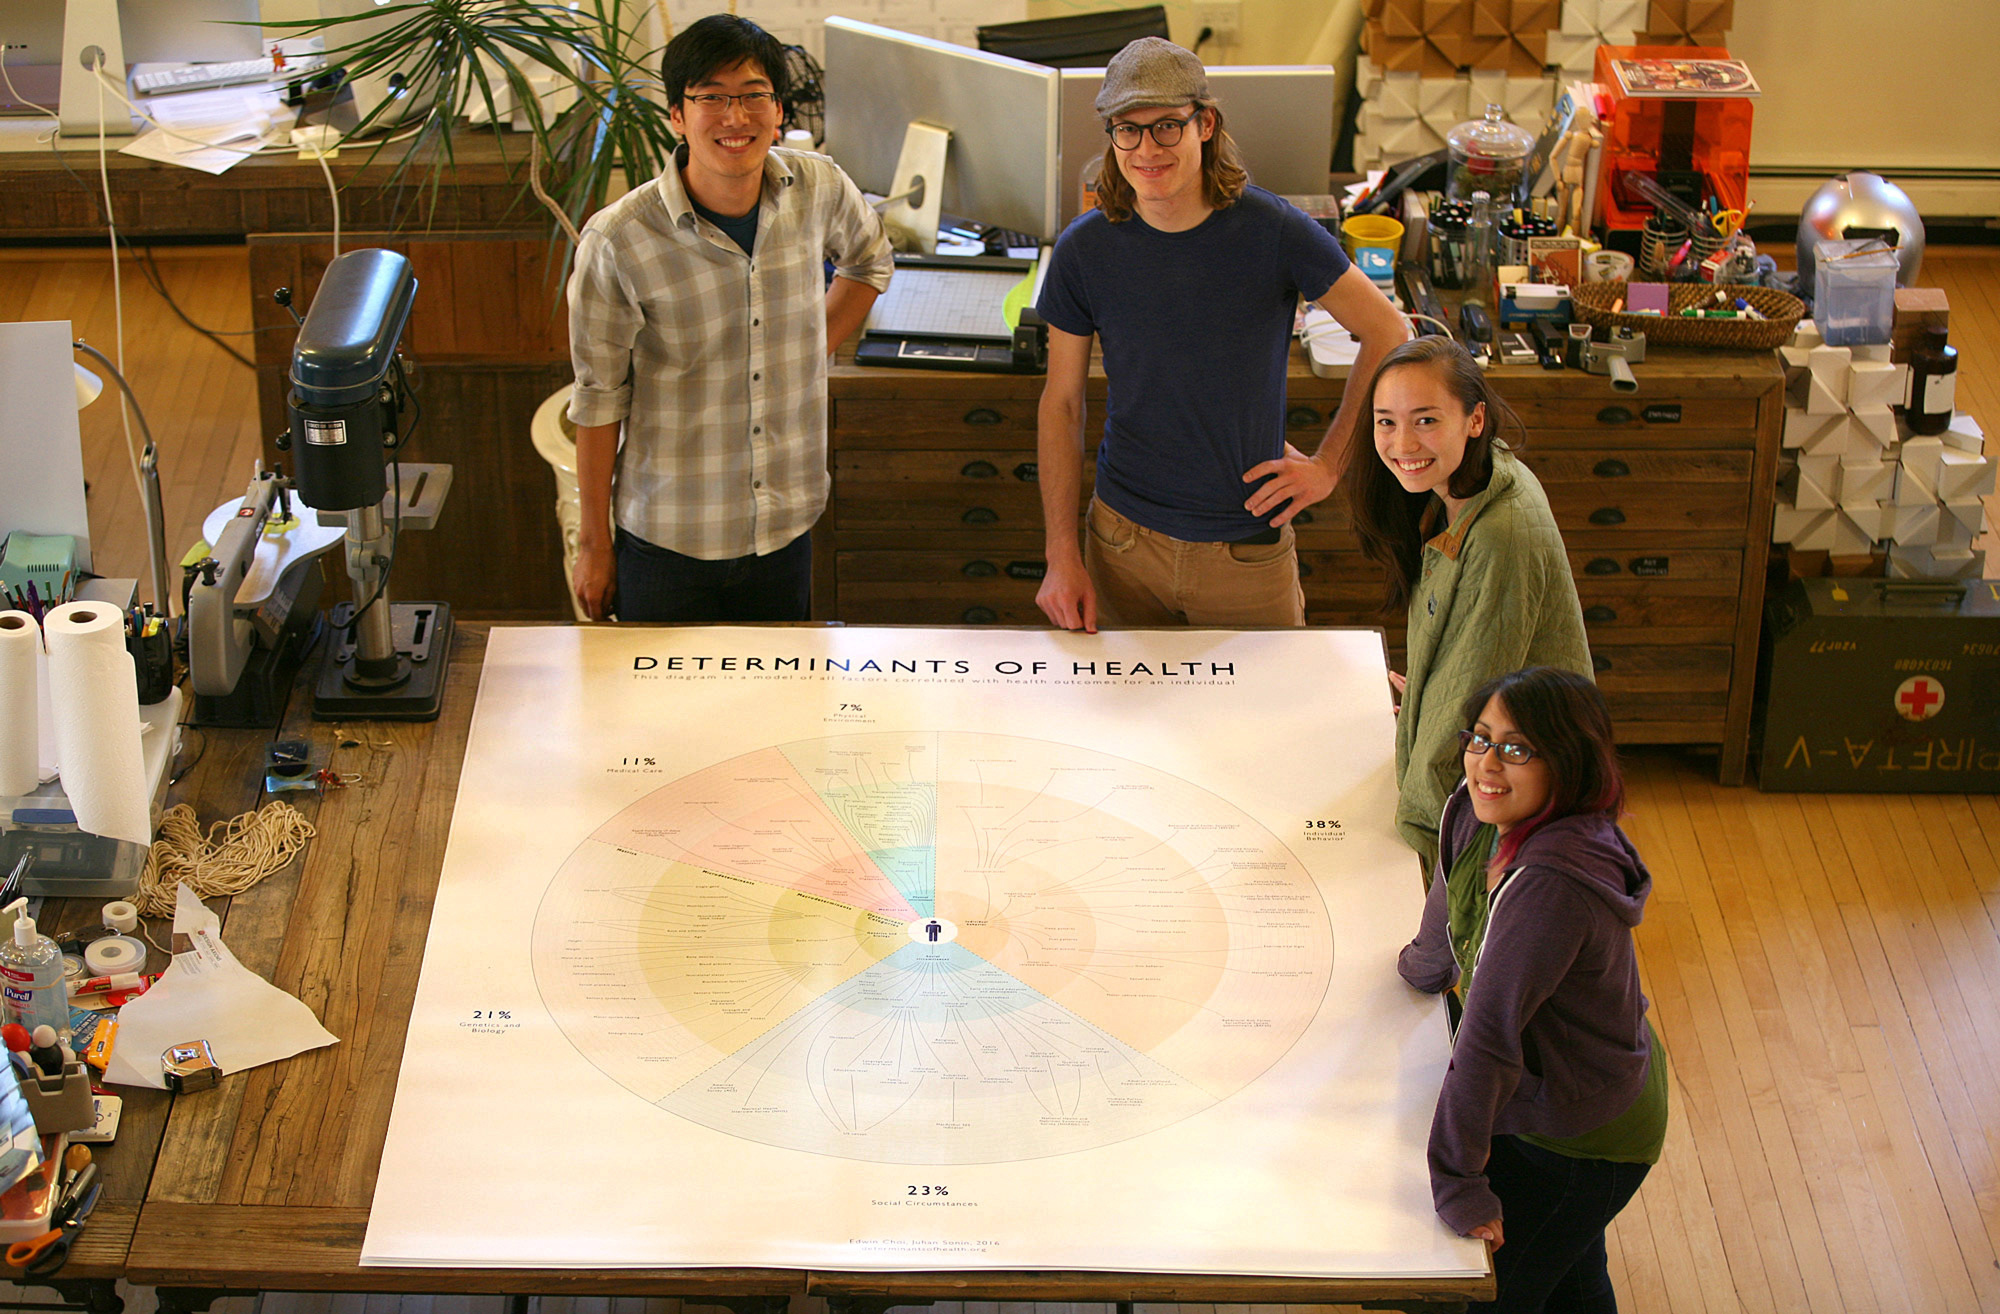
About GoInvo
GoInvo is a healthcare design company that crafts innovative digital and physical solutions. Our deep expertise in Health IT, Genomics, and Open Source health has delivered results for the National Institutes of Health, Walgreens, Mount Sinai, and Partners Healthcare. Reach out for a custom installation or feedback.
Methodology
Below is a description of the methodology used in creating the Determinants of Health visualization. It is also a record of versioned updates to the methodology and visualization based on continuing research and feedback. Thank you to those who have reached out and helped identify areas to improve.
v1 - 26.Jul.2017
The 5 main determinants of health (genetics, medical care, social circumstances, environment, and individual behavior) were chosen due to their consistency across the following 7 out of 8 organizations:
- NCHHSTP1
- WHO2
- Healthy People3
- Kaiser Family Foundation4
- NEJM5
- Health Affairs6
- Institute of Medicine7
- New South Wales Department of Health8
The lists of determinants published from each of the previously mentioned organizations were compiled and compared1 - 8. There was no standard in terms of the number of determinants, hierarchical organization of the determinants, and the naming for the determinants (for example, quality of housing3 vs residence quality7). The most thorough publication for the determinants came from the Institute of Medicine report7. Therefore this was the primary source from which the list of 95 determinants within the visualization originated.
The section below documents our analysis of the data and how we calculated the final impact percentages for the 5 main categories of determinants.
The relative contribution of each of the determinant categories to one's health was found using the estimated values referenced by the seven primary sources listed below.
Each determinant category was then averaged based on the values from each of the aforementioned sources (the methodology in the primary sources were different depending on the source. The final percentages should therefore be an estimate and not be viewed as absolute numbers).
Behavior: (50 + 38 + 40 + 39 + 36 + 45 + 30) / 7 = 39.71*
Social: (15 + 40) / 2 = 27.5
Genetics: (20 + 30) / 2 = 25
Medical care: (10 + 10 + 20) / 3 = 13.33
Environment: (20 + 7 + 5 + 5.4 + 3 + 10) / 6 = 8.4
*An original miscalculation of 'Behavior' has been rectified. The following values have subsequently been updated.
The ratio for each determinant was then found by taking the average values found for each of the determinant categories and dividing them by the total determinant value.
Behavior: 39.71 / 113.94 = 34.85%
Social: 27.5 / 113.94 = 24.14%
Genetics: 25 / 113.94 = 21.94%
Medical care: 13.33 / 113.94 = 11.70%
Environment: 8.4 / 113.94 = 7.37%
Total: 34.85 + 24.14 + 21.94 + 11.70 + 7.37 = 100%
The final percentages are as follows.
Behavioral determinants at 35%.
Social determinants at 24%.
Genetic determinants at 22%.
Medical care determinants at 12%.
Environmental determinants at 7%.
v2 - 30.Aug.2017
The following are updated calculations for the relative contributions of each of the determinant categories. The relative contribution of each of the determinant categories to one's health was found using the values referenced from the six sources listed below.
Each determinant category value is an average based on adding the values from each of the aforementioned sources.
Behavior: (50% [9] + 42% [10] + 40% [11] + 45% [12] + 30% [15]) / 5 = 41.4%
Social: (15% [11] + 40% [15]) / 2 = 27.5%
Genetics: (20% [9] + 30% [11]) / 2 = 25%
Medical care: (10% [9] + 10% [11] + 20% [15]) / 3 = 13.33...%
Environment: (20% [9] + 3% [10] + 5% [11] + 3.9% [14] + 10% [15]) / 5 = 8.38%
Additional notes on the determinant category values: For source10, The environmental value of ~3% was based on dividing toxic agent deaths (60,000 deaths. Toxic agents were defined as occupational hazards, environmental pollutants, contaminants of food and water supplies, and components of commercial products) divided by total deaths for that year (2,120,000).
The average values found for each of the determinant categories were each divided by the total determinant value.
Total value: 41.4% + 27.5% + 25% + 13.33...% + 8.38% = 115.6133
Behavior: 41.4% / 115.6133... = 35.81%
Social: 27.5% / 115.6133... = 23.79%
Genetics: 25% / 115.6133... = 21.62%
Medical care: 13.33...% / 115.6133... = 11.53%
Environment: 8.38% / 115.6133... = 7%
The final percentages are as follows.
Behavioral determinants at 36%
Social determinants at 24%
Genetic determinants at 22%
Medical care determinants at 11% (rounded down)
Environmental determinants at 7%
v3 - 15.Nov.2018
The following is a more detailed explanation of the values used to find the relative contributions of each of the determinant categories.
Each determinant category value is an average based on adding the values from each of the aforementioned sources.
Behavior: (50% [9] + 43% [10] + 40% [11] + 43% [12] + 30% [15]) / 5 = 41.20%
Social: (15% [11] + 40% [15]) / 2 = 27.50%
Genetics: (20% [9] + 30% [11]) / 2 = 25.00%
Medical care: (10% [9] + 10% [11] + 20% [15]) / 3 = 13.33...%
Environment: (20% [9] + 3% [10] + 5% [11] + 4% [14] + 10% [15]) / 5 = 8.40%
The environmental value of ~3%10 was based on taking toxic agent deaths (60,000, defined as occupational hazards, environmental pollutants, contaminants of food and water supplies, and components of commercial products) and dividing by total deaths for the year of 1990 (2,120,000).
The behavior value of 42%10 was based on taking the causes of death in 1990 due to behavior (50%, page 2208) and subtracting deaths caused by microbial & toxic agents (4% + 3%, page 2208) = 43%.
The behavior value of 45%12 was based on taking the causes of death in 2000 (48.2%, page 1240), and subtracting deaths caused by microbial & toxic agents (3.1% + 2.3%, page 1240) = 42.8% → 43%.
The environment value of 4%14 was based on global risk for burden of disease due to unsafe water, sanitation and hygiene (4%, page V).
The average values found for each of the determinant categories were each divided by the total determinant value.
Total value: 41.2% + 27.5% + 25% + 13.33...% + 8.38% = 115.413...
Behavior: 41.2% / 115.413... = 35.70%
Social: 27.5% / 115.413... = 23.83%
Genetics: 25% / 115.413... = 21.66%
Medical care: 13.33...% / 115.413... = 11.55%
Environment: 8.4% / 115.413... = 7.28%
The final percentages are unchanged from v2.
Behavioral determinants at 36%
Social determinants at 24%
Genetic determinants at 22%
Medical care determinants at 11% (rounded down)
Environmental determinants at 7% (rounded down)
Additional Change
14.Feb.2018
Race and ethnicity have been removed from the biology section due to a lack of standard objective criteria in the scientific community surrounding the use of genetics to define race and ethnicity. It has been added to the Social Circumstance section due to its continued social importance in describing groups based on similar characteristics. View the following literature for additional detail:
- Fujimura, J. H., & Rajagopalan, R. (2010). Different differences: The use of 'genetic ancestry' versus race in biomedical human genetic research. Social Studies of Science, 41(1), 5-30. doi:10.1177/0306312710379170
- Long, J. C., & Kittles, R. A. (2003). Human Genetic Diversity and the Nonexistence of Biological Races. Human Biology, 75(4), 449-471. doi:10.1353/hub.2003.0058
- AR, T. (2013). Biological races in humans. [Abstract]. Stud Hist Philos Biol Biomed Sci, 262-271. Retrieved February 14, 2018, from https://www.ncbi.nlm.nih.gov/pubmed/23684745.
- Caprio, S., Daniels, S. R., Drewnowski, A., Kaufman, F. R., Palinkas, L. A., Rosenbloom, A. L.,... Kirkman, M. S. (2008). Influence of Race, Ethnicity, and Culture on Childhood Obesity: Implications for Prevention and Treatment. Obesity, 16(12), 2566-2577. doi:10.1038/oby.2008.398
Discrimination can be further subdivided into racial, ethnic, gender, sexuality, and age based discrimination.
Poster images have been updated based on the updated Aug 2017 calculations.
14.Apr.2020
Spanish poster version added, based on the updated Aug 2017 calculations. Translation by Roberto Laureles.
Frequently asked questions
What are the 5 determinants of health?
GoInvo groups them into five categories, with their estimated contribution to overall health: individual behavior (about 36%), social circumstances (about 24%), genetics and biology (about 22%), medical care (about 11%), and environment (about 7%).
What are the social determinants of health?
The social determinants of health are the non-medical conditions in which people are born, live, work, and age, such as education, income, employment, housing, and community, that shape health outcomes. They account for roughly a quarter of overall health.
How much of our health is determined by medical care?
Medical care accounts for only about 11% of health outcomes in GoInvo's analysis. The other 89% is shaped by behavior, social circumstances, genetics, and environment, outside the clinical setting.
How much of health happens outside the doctor's office?
About 89% of health happens outside the clinical space, driven by our genetics, behavior, environment, and social circumstances.
Authors

Edwin Choi, GoInvo

Juhan Sonin, GoInvo, MIT
Contributors

Daniel Reeves, GoInvo

Bryson Wong, GoInvo

Hrothgar, GoInvo

Kelsey Kittelsen, Dartmouth College
References
- 1.NCHHSTP Social Determinants of Health. (2014). Retrieved March 14, 2016 (archived link): https://web.archive.org/web/20160306043016/http://www.cdc.gov/nchhstp/socialdeterminants/definitions.html
- 2.The determinants of health. (n.d.). Retrieved March 14, 2016: http://www.who.int/hia/evidence/doh/en/
- 3.Social Determinants of Health. (n.d.). Retrieved March 14, 2016 (archived link): https://web.archive.org/web/20160304051014/https://www.healthypeople.gov/2020/topics-objectives/topic/social-determinants-of-health
- 4.Beyond Health Care: The Role of Social Determinants in Promoting Health and Health Equity. (n.d.). Retrieved March 14, 2016: http://kff.org/disparities-policy/issue-brief/beyond-health-care-the-role-of-social-determinants-in-promoting-health-and-health-equity/
- 5.Schroeder, S. A. (2007). We Can Do Better — Improving the Health of the American People. New England Journal of Medicine N Engl J Med,357(12), 1221-1228.
- 6.The Relative Contribution of Multiple Determinants to Health Outcomes. (n.d.). Retrieved March 14, 2016: http://healthaffairs.org/healthpolicybriefs/brief_pdfs/healthpolicybrief_123.pdf
- 7.Capturing social and behavioral domains and measures in electronic health records: Phase 2. (2014). Washington D.C.: The National Academies Press.
- 8.Gruszin, S., & Jorm, L. (2010, December). Public Health Classifications Project (Rep.). Retrieved March 15, 2016, from New South Wales Department of Health website: http://www.health.nsw.gov.au/hsnsw/Publications/classifications-project.pdf
- 9.DHHS, Public Health Service. "Ten Leading Causes of Death in the United States." Atlanta (GA): Bureau of State Services, July 1980
- 10.J.M.McGinnis and W.H.Foege. "Actual Causes of Death in the United States." JAMA 270, No. 18 (1993):2207-12
- 11.J.M.McGinnis et al, "The Case for More Active Policy Attention to Health Promotion." Health Affairs 21, no.2 (2002):78-93
- 12.A.Mokdad et al. "Actual Causes of Death in the United States 2000." JAMA 291, no.10 (2004):1238-45
- 13.G.Danaei et al, "The Preventable Cuases of Death in the United States: Comparative Risk Assessment of Dietary, Lifestyle, and Metabolic Risk Factors." PLoS Medicine 6, no. 4 (2009):e1000058
- 14.World Health Organization, Global Health Risks: Mortality and Burden of Disease Attributable to Selected Major Risks, Geneva: WHO, 2009
- 15.B. Booske et al., "Different Perspectives for Assigning Weights to Determinants of Health." County Health Rankings Working Paper. Madison (WI): University of Wisconsin Population Health Institute, 2010
- 16.Schneiderman, N., Ironson, G., & Siegel, S. D. (2005). STRESS AND HEALTH: Psychological, Behavioral, and Biological Determinants. Annual Review of Clinical Psychology, 1, 607-628. Retrieved March 16, 2016: http://www.annualreviews.org/doi/abs/10.1146/annurev.clinpsy.1.102803.144141?url_ver=Z39.88-2003&rfr_dat=cr_pub=pubmed&rfr_id=ori:rid:crossref.org&journalCode=clinpsy