Problem
The major issues and statistics for US healthcare are tough to understand and see, even in a data and analysis-rich “command” center, let alone on your phone. The MITRE Health Lab needed a large-scale, national healthcare storytelling service, to show public health officials, researchers, and policy makers the ground truth.
Solution
An interactive healthcare story engine that help researchers and scientists to showcase their work in context of national problem sets and information.
Results
We designed and shipped an open source touch screen service to show public health information and stories.
Time: 2.5 designers/engineers for 12 weeks
Tags: Government, Healthcare, Public Health & Policy, Open Source, Interactive wall
Understanding the problem
Seeing National Problems with a flick of a finger
Located across the street from the Centers for Medicare and Medicaid in Baltimore, the MITRE HealthLab, a hub of healthcare policy meetings, needed an interactive, visual story engine to walk through national healthcare issues, statistics, and projects.
Look across the nation, act locally
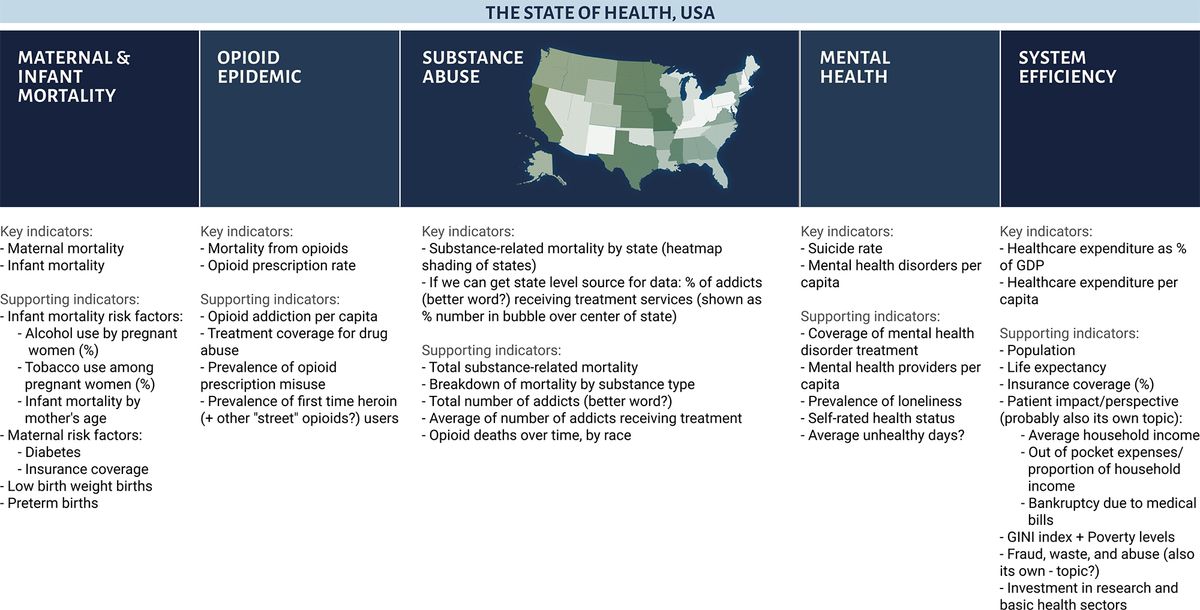
Using global, national, and local data sources, we crafted key questions and US Healthcare storylines.
Solution
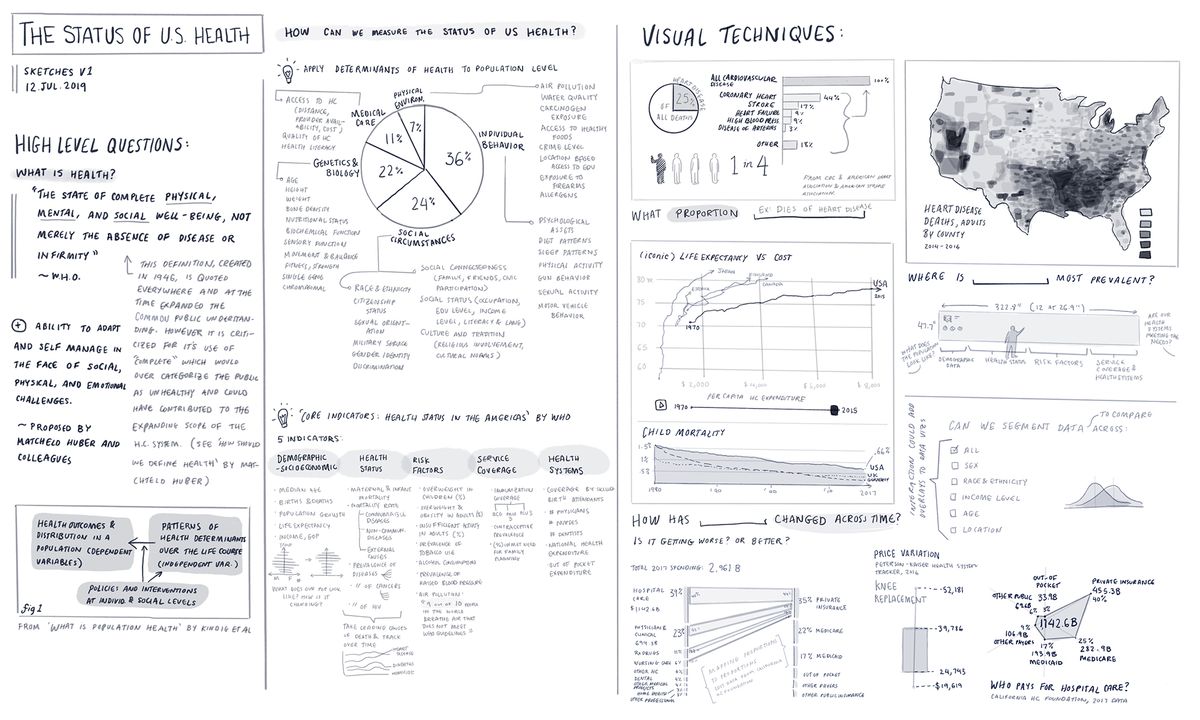
Fast sketching and prototyping
Storylines were first written in short paragraph form, evolved through and accompanied with rough storyboards, evidence, and graphic representations.
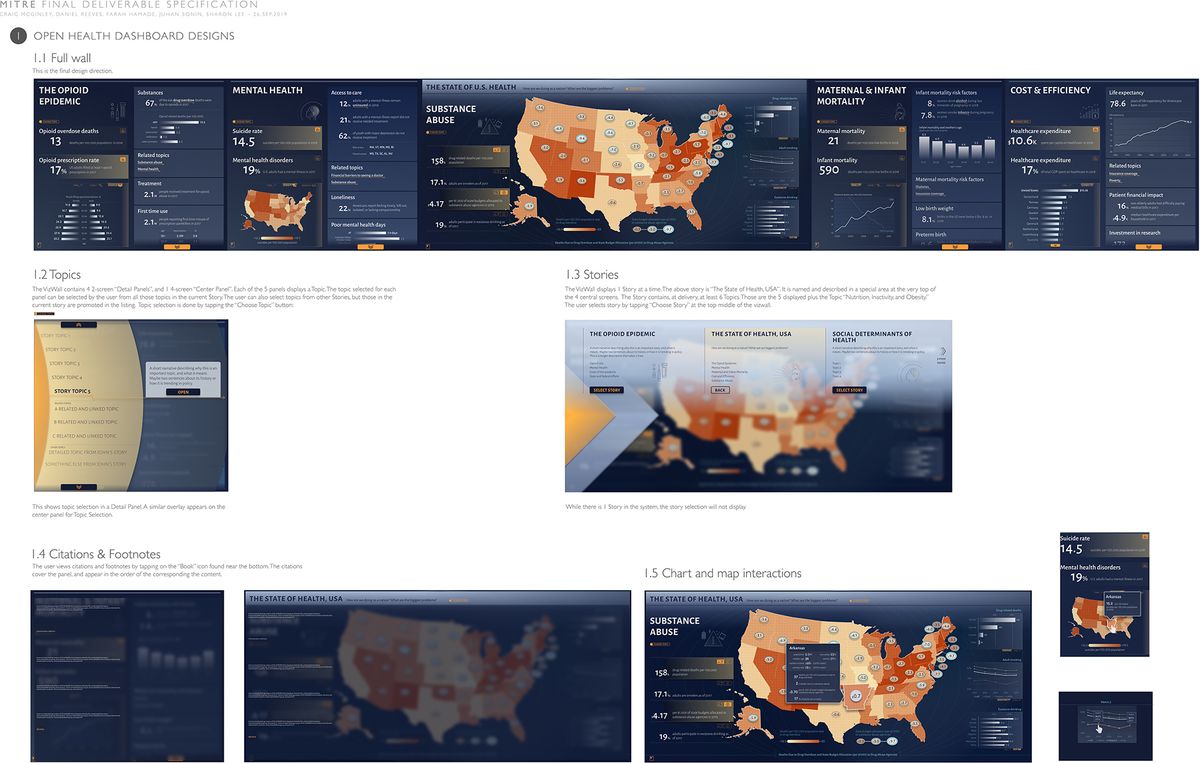
Large scale technical storytelling, for a technical audience
A touchscreen data wall made up of 12 LCD panels side by side was the primary display for healthcare walkthroughs. Because the touchscreen software limited customizable experiences, we worked with the company that provided the interactive panels to design and engineer the new functions. Although their customer service for everyday problems was very good; the business model at the root of the software limitations is a detriment to innovation, self-curation, and evolving the software from outside their firewall.
We worked around this closed “feature” by extending the built-in Chrome browser to expand contiguously across all 12 touchscreens. We then developed a custom experience using open web standards at a fraction of the cost, pain, and time.
Results
Open Source Scientific Storytelling
MITRE open sourced the US Healthcare Dashboard experience so other government agencies and healthcare companies can use, update, and evolve the interactive stories.
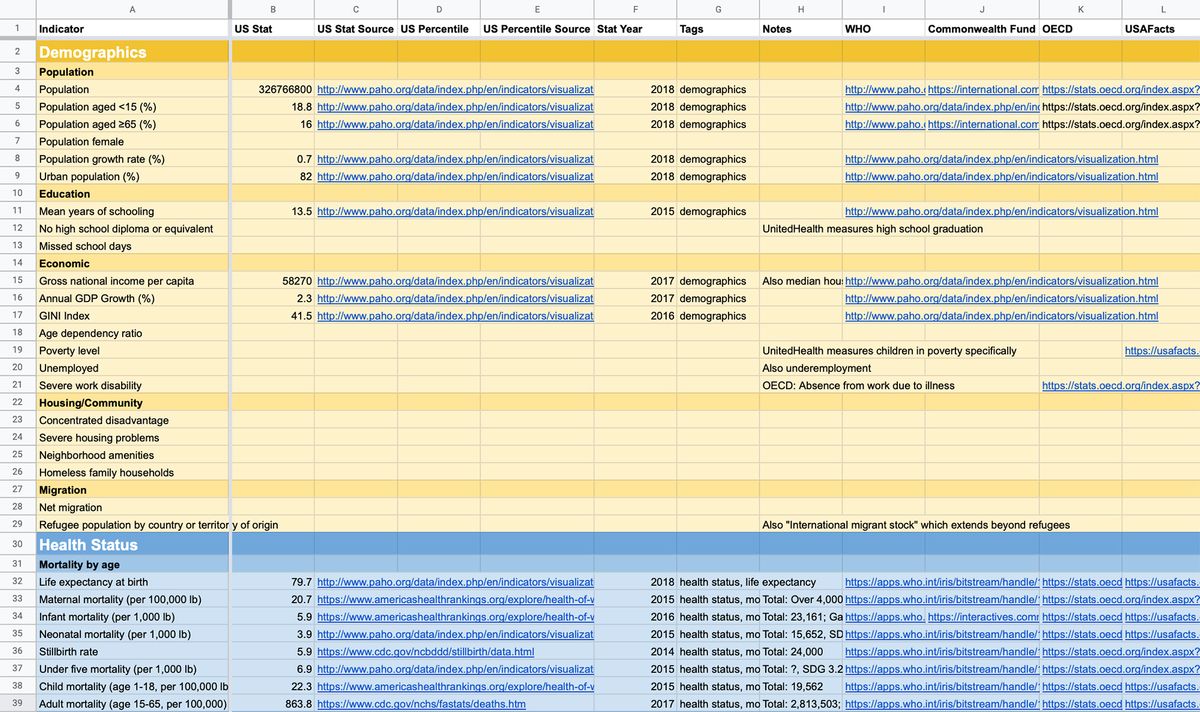
Global Health Indicators List
We conducted an analysis on metrics necessary to measure population health, and compiled a comprehensive repository of current health indicators, available online for anyone across the planet to use as a resource.