The problem
Ipsos grew into a global research enterprise spanning 50+ countries, regional teams, acquisitions, and independently evolving operational systems.
Project setup lived in one tool.
Quoting in another.
Staffing, field execution, reporting, and billing each operated through separate workflows, data structures, and logic.
The operational backbone became a patchwork of:
- Homegrown software
- Acquired platforms
- Spreadsheets
- Email coordination
- Manual handoffs
- Duplicated workflows
Quote
Planning
Preparation
Collection
Preparation
Analytics
Reporting
to Client
The actual system of record was often Excel.
As projects evolved mid-execution, critical context was repeatedly lost between systems.
Leadership lacked real-time operational visibility across the lifecycle of the work.
Each tool solved a local problem.
Few solved the enterprise one.
Designing the Operational Backbone
GoInvo partnered with Ipsos to help design a more connected operational foundation:
Reducing friction,
Improving visibility,
And creating continuity across the quote-to-execution lifecycle.
This was not a dashboard redesign.
It was systems work:
- Workflow architecture
- Operational modeling
- Interaction design
- Shared UI systems
- Organizational alignment
Early principles included:
- Shared object definitions and APIs
- Reusable workflow patterns
- Interaction design
- OHIO (“Only Handle Information Once”)
- Operational flow inspired by logistics systems like FedEx
The challenges
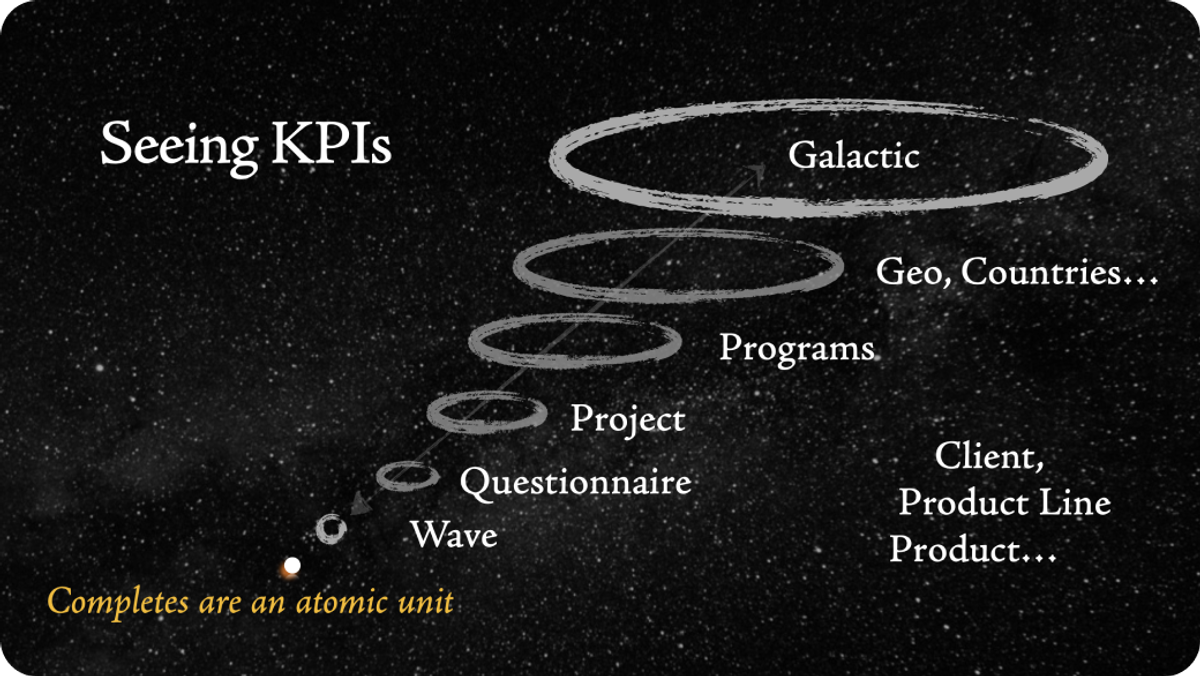
How should users experience continuity across systems whose underlying operational states constantly change?
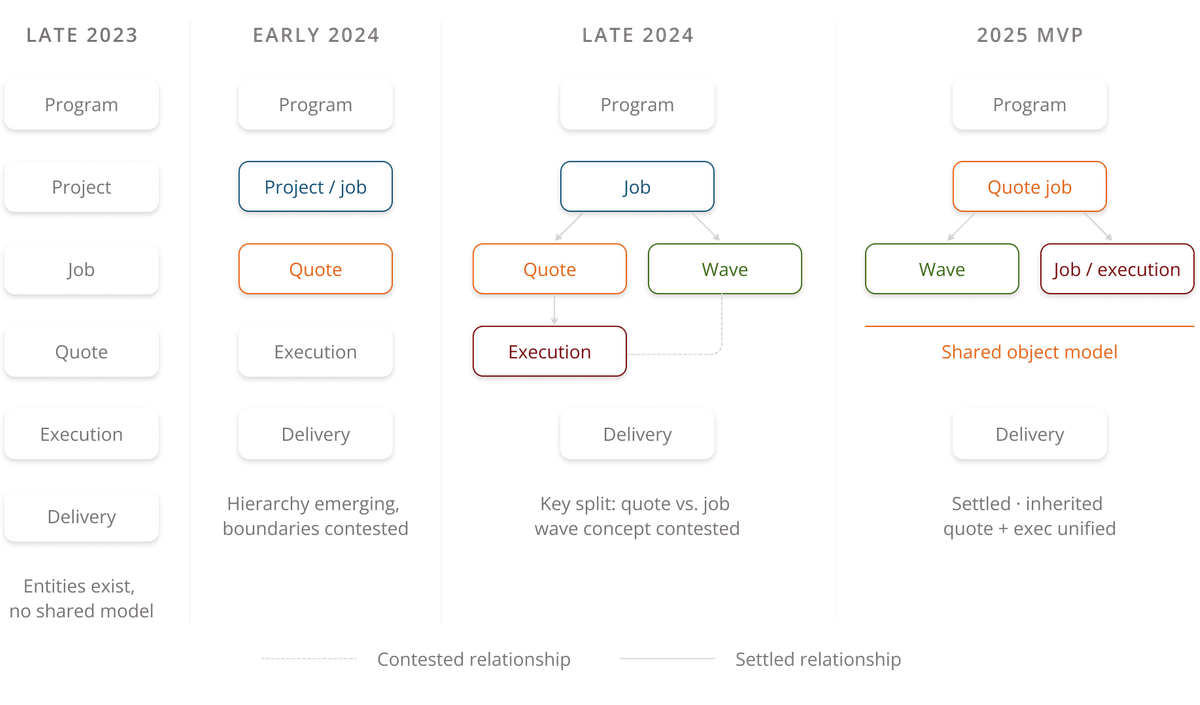
A quote becomes a sold project.
A sold project becomes a staffed execution.
Execution evolves across waves, markets, budgets, and delivery realities.
Technically, these were different objects.
Operationally, users experienced them as one evolving project.
That insight shaped the platform:
User continuity over object fidelity.
The interface became the argument for how the operational model itself needed to behave.

Designing Inside a Living Organization
The hardest problems were not visual.
Operational decisions were distributed across research leadership, operations, finance, regional teams, and engineering groups spanning dozens of countries.
Workflows evolved through years of accumulated edge cases, spreadsheet logic, and local optimizations.
The work required balancing:
- Local flexibility
- Enterprise consistency
- Adoption realities
- Evolving scope
- Organizational restructuring
Midway through the program, the engineering organization reorganized into five parallel pods while platform development accelerated.
Maintaining coherence across workflows, systems, and interaction patterns became part of the design responsibility itself.
We were not designing in ideal conditions.
We were designing in the conditions large organizations actually operate within.
The outcomes
from first meeting to final delivery
consolidated into 1
Scale and complexity of projects supported
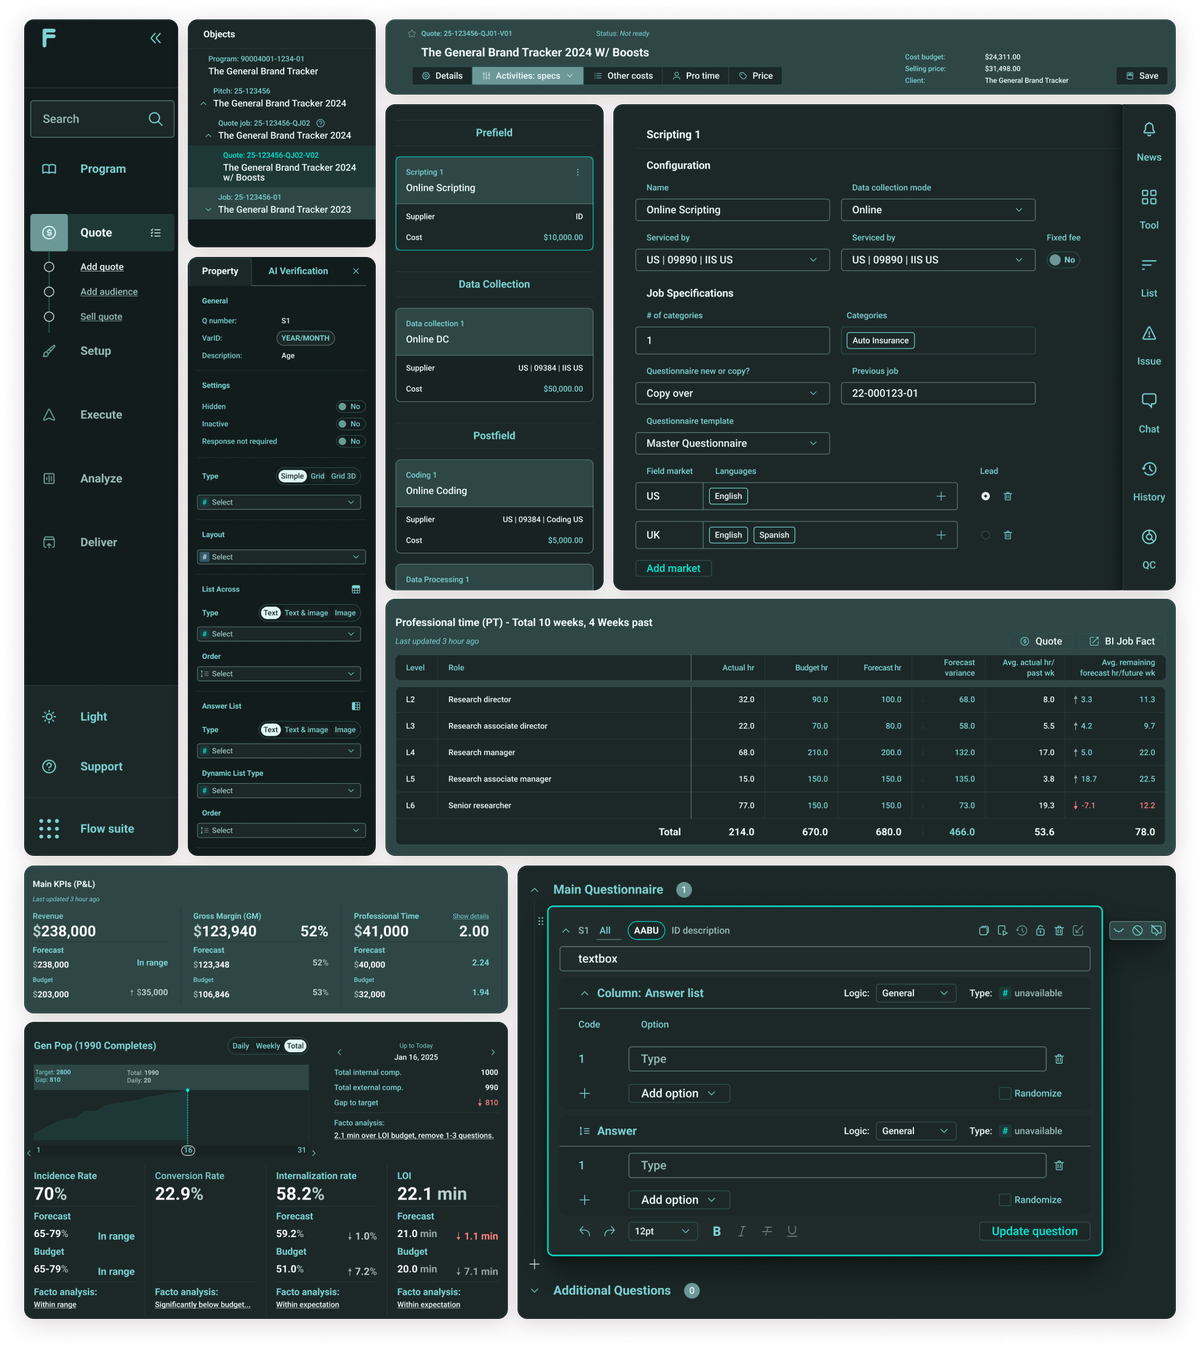
Over multiple years, Ipsos evolved toward a more unified operational platform:
One place where projects could move from quote to execution with shared visibility across teams and lifecycle stages.
The work established:
- Shared workflow foundations
- Reusable operational patterns
- Connected lifecycle views
- Common interaction systems
- Stronger continuity across operational states
Not a prototype.
Not a concept deck.
A live operational platform evolving inside one of the world’s largest research organizations.
Interested in complex digital healthcare systems and user experience design?
Get in touch
or email us at info@goinvo.com
Authors

Chloe Ma, GoInvo
Chloe is a designer and researcher specializing in medical and scientific storytelling. She drives to improve healthcare equity, education, and accessibility through good design. Chloe joined Invo in 2021 with a BS in BioChemistry and Molecular Biology from Dalhousie University and a MSc in Biomedical Communication from University of Toronto.

Craig McGinley, GoInvo
Craig is an engineer devoted to full stack design and development. He brings skillful javascripting, front-end development techniques, and application logic design to software projects. Craig joined Invo in 2014 as a Launch Academy graduate, vegan, and a musician.

Juhan Sonin, GoInvo
Juhan Sonin leads GoInvo with expertise in healthcare design and system engineering. He’s spent time at Apple, the National Center for Supercomputing Applications (NCSA), and MITRE. His work has been recognized by the New York Times, BBC, and National Public Radio (NPR) and published in The Journal of Participatory Medicine and The Lancet. He currently lectures on design and engineering at MIT.


